TL;DR
This is Part 2 of a two-part documentary essay on the Port of San Francisco. Part 1 maps what the Port is, what it earns money doing, what has happened to its industrial portfolio, and the capital backlog the next Commission will inherit. Part 2 documents the institutional record. It covers the geographic concentration, the 35-year thread on Proposition H, the Commission’s operating pattern, and the Summer 2026 decision window. Four findings in this part.
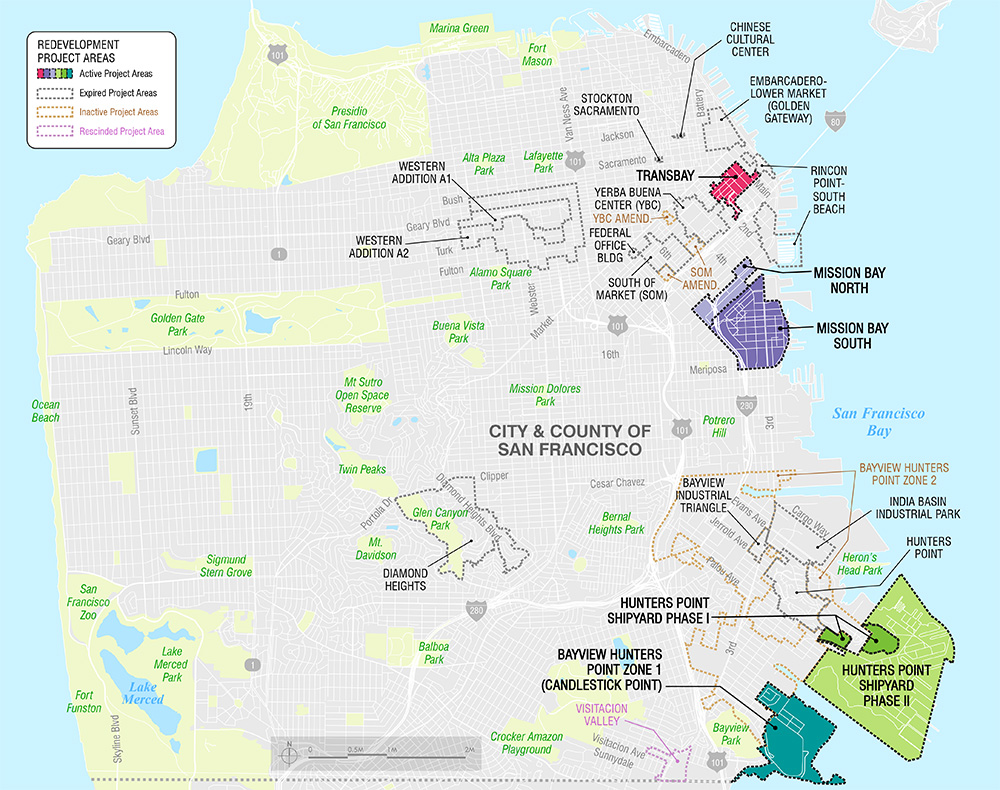
- Geographic concentration. Roughly 80% of the Port’s currently industrial-zoned acreage sits in or adjacent to District 10 (Bayview-Hunters Point). Two community-led planning frameworks for this geography are now expired or inactive: the 1969 India Basin Industrial Park Plan and the 2000 BVHP Community Plan, both centered on labor-intensive job creation for Bayview residents. The option space for the adjacent Southern Waterfront industrial parcels depends materially on the federal Hunters Point Naval Shipyard Superfund cleanup, an approximately $1.15B federal obligation running since 1989 and projected through approximately 2050.
- Asymmetric leasing. Maritime tenants receive codified rent relief (salmon and crab waivers, seasonal berth waivers, 75% parameter rent for triple-use tenants). Industrial tenants on the Southern Waterfront receive pass-through market-rate ground leases. The two categories map onto the two coastlines.
- Credit rating context. The Port of San Francisco carries the highest non-maritime revenue diversification within its AA-rated US port peer group. Rating agencies treat that diversification as value-accretive.
- Summer 2026 decision window. Three of five Commission seats expire in May 2026, the Executive Director seat is being recruited, and the Port has just adopted a new Strategic Plan that does not name industrial preservation as a priority. Mayor Lurie will set the three Commission seats and influence the ED hire.
This essay does not argue what should be. It assembles what is.
What This Land Is For
Two reference points anchor what San Francisco’s industrial-zoned land is for. A working private comparator one mile inland from Pier 70, and the City’s own documented case for protecting industrial-zoned land as a distinct asset class.
A privately-operated comparison
One mile inland from Pier 70 sits a privately-operated industrial property that has followed a different trajectory than the Port’s industrial portfolio. It operates under the second industrial-land regime, the PDR districts established by the Eastern Neighborhoods rezoning. The Planning Code’s stated purpose for PDR:
“new and evolving industry and activity types that cannot be foreseen today and cannot practically function or compete for space in a typical downtown office or neighborhood commercial environment.”
The American Industrial Center, at 2325 Third Street in the Dogpatch, occupies 32 acres and contains approximately one million square feet of multi-story industrial building space. It has been owned and operated by the Markoulis family since 1975. It hosts more than 285 tenants spanning manufacturing, robotics and aerospace R&D, biotechnology and life sciences laboratories, food production and distribution, art studios, and a ground-floor amenity layer. The multi-story configuration allows stacked tenancy single-story warehousing does not. Occupancy has been sustained continuously through multiple real-estate cycles, the 2020-22 pandemic, and the post-pandemic recovery. The capital stack has remained private throughout, with no public funding, no entitlement legislation, no master indenture amendment, and no fiscal-sponsor pressure to monetize.
Over the same FY 2015 to FY 2022 window during which the Port’s reported industrial-portfolio acreage declined by 43%, the American Industrial Center’s tenant count and operating model held essentially constant. The Port was reclassifying 2.5 to 3 million square feet of industrial-zoned acreage at Pier 70 and Mission Rock into Development Ground Leases. The American Industrial Center, one mile inland on land of comparable character, was continuing to operate as a multi-tenant industrial facility. This essay does not assert that the Port should have managed its industrial-zoned acreage the way the American Industrial Center has managed its 32 acres. The two operate under different constraints: the American Industrial Center carries no public trust mandate, no seawall obligation, no $2.6 billion capital backlog, and no fiscal-sponsor pressure to monetize. It is privately capitalized PDR-zoned land with fifty years of continuous single-family operating ownership. The comparison is not what the Port should have done. It is what the same San Francisco industrial-land geography has produced under different ownership and different constraints.
A distinct asset class, by the City’s own definition
In July 2002, the SF Planning Department published “Industrial Land in San Francisco: Production, Distribution and Repair (PDR)”. The study asked a direct question: should the city continue to zone any of its land for industrial use, given the rent pressure to convert that land to office and residential use? The answer was yes. The reasoning was that some economic activities cannot pay downtown office rent, cannot fit into neighborhood commercial space, and cannot be built once they are displaced. Industrial-zoned land protects those activities.
Six years later, in December 2008, the Board of Supervisors operationalized that finding by adopting the Eastern Neighborhoods rezoning and creating the Production, Distribution, and Repair (PDR) districts in Planning Code Section 210.3. The Planning Code’s statement of purpose for PDR, quoted above, names the activities directly: new and evolving industry types that cannot be foreseen today and cannot practically function or compete for space in a typical downtown office or neighborhood commercial environment.
The 2002 study and the 2008 rezoning treat industrial-zoned land as a distinct municipal asset class — not as one real-estate category among many but as one that, once converted, cannot easily be recreated. No working precedent in San Francisco exists for converting rezoned residential or office land back to industrial use.
Middle-wage jobs, by the City’s own framing
The activities PDR protects are not narrow. They include light manufacturing, machine shops, food production, biotech wet-lab space, robotics and aerospace R&D, electric-vehicle prototyping, energy-systems integration, construction trades, distribution and logistics, and the hardtech tenancy that fills properties like the American Industrial Center. These are the activities that, by the City’s own framing, generate middle-wage employment for workers without four-year degrees.
The empirical record on this is documented. The Bay Area Council Economic Institute has reported repeatedly on the wage premium attached to advanced-industries employment in the Bay Area, the share of that employment that does not require a four-year degree, and the household-level economic stability associated with mid-wage manufacturing and technical work. Its “Technology Works: High-Tech Employment and Wages in the United States” is one canonical reference. The Brookings Metropolitan Policy Program’s “America’s Advanced Industries” framework, published 2015 and updated since, documents the same pattern at national scale. Advanced-industries employment carries a wage premium over the broader service economy, and the physical space those industries require is the precondition for the employment.
The 1969 India Basin Industrial Park Plan and the 2000 BVHP Community Plan, both documented in Section 6, made the same claim in different language: industrial-zoned land in Bayview-Hunters Point is the physical precondition for labor-intensive employment of district residents. The 1969 Plan, the 2000 Plan, the 2002 citywide industrial-lands study, and the 2008 Eastern Neighborhoods rezoning each made the same finding. Industrial-zoned land in San Francisco is jobs infrastructure for residents without graduate degrees.
Housing and industrial-zoned land are not in tension
One framing recurs in San Francisco land-use discussion. Industrial-zoned land in a housing-constrained city, the argument goes, should be converted to housing. The pressure behind this framing is real. San Francisco’s housing shortage is acute and well-documented. The City’s 2002 industrial-lands study and the 2008 Eastern Neighborhoods rezoning took that pressure as given and asked a different question.
If every parcel zoned for industrial use is eventually converted to housing or office, what economic activities does the city lose, and what employment base does it lose with them? The 2002 study and the 2008 rezoning answered that question by treating industrial-zoned land as a distinct asset class, protected not against housing as such but against the conversion of all middle-wage employment space into residential and high-end commercial use. The Eastern Neighborhoods rezoning that established PDR also rezoned substantial acreage for residential development. Housing and industrial-zoned land were treated, in that planning record, as complementary rather than competing categories.
Mission Rock and Pier 70, both on the Port’s Central Waterfront, are mixed-use developments combining residential, office, and ground-floor PDR-compatible space under site-specific California legislation. The American Industrial Center, one mile inland, operates with residential housing immediately adjacent on the same block. The working San Francisco models in 2026 mix residential and industrial-zoned uses at the parcel and block level. At any specific parcel, allocation between housing, office, and industrial use is a decision made by City and Port action. At the citywide land-category level, SF Planning’s 2002/2008 record treats housing and industrial-zoned land as complementary rather than competing categories. The question on the table is not whether to convert industrial-zoned land to housing or to preserve it as is. The Eastern Neighborhoods rezoning and the working San Francisco models already show how the two coexist. The question is what happens to the industrial-zoned share in the existing mix as the next ten years of land-use decisions play out.
What the Port’s current Strategic Plan engages
The 2026-2030 Strategic Plan, addressed in Section 7, names housing development at Mission Rock, Pier 70, and Seawall 330 as priorities under Economic Growth. It names maritime industries under the same goal. It does not engage the 2002 industrial-lands framing or the 2008 Eastern Neighborhoods rezoning’s treatment of industrial-zoned land as a distinct municipal asset class. The 2002 industrial-lands study and the 2008 Eastern Neighborhoods rezoning are not referenced in the Port’s 2026-2030 Strategic Plan.
The Geographic Concentration
The Port’s currently industrial-zoned acreage sits in four locations: Pier 70 backlands, Pier 80, the Pier 90-94 complex, and Pier 96. Roughly 80% of this acreage is in or directly adjacent to District 10, Bayview-Hunters Point. The Pier 92 concrete batch plants (Central Concrete and Hanson Aggregates), which Part 1 names as the city’s sole concrete supply, sit immediately east of Heron’s Head Park within this acreage.
Pier 80 operates as a long-term lease to Pasha Stevedoring for automobile import/export and project cargo (Figure 6a). Piers 90 and 94 host construction-equipment staging and storage tenancy. Pier 92 holds the concrete batch plants (Figure 6b). Heron’s Head Park, a 24-acre restored wetland and shoreline park at the foot of Jennings Street, sits between the active industrial piers and the District 10 residential community (Figure 6c).
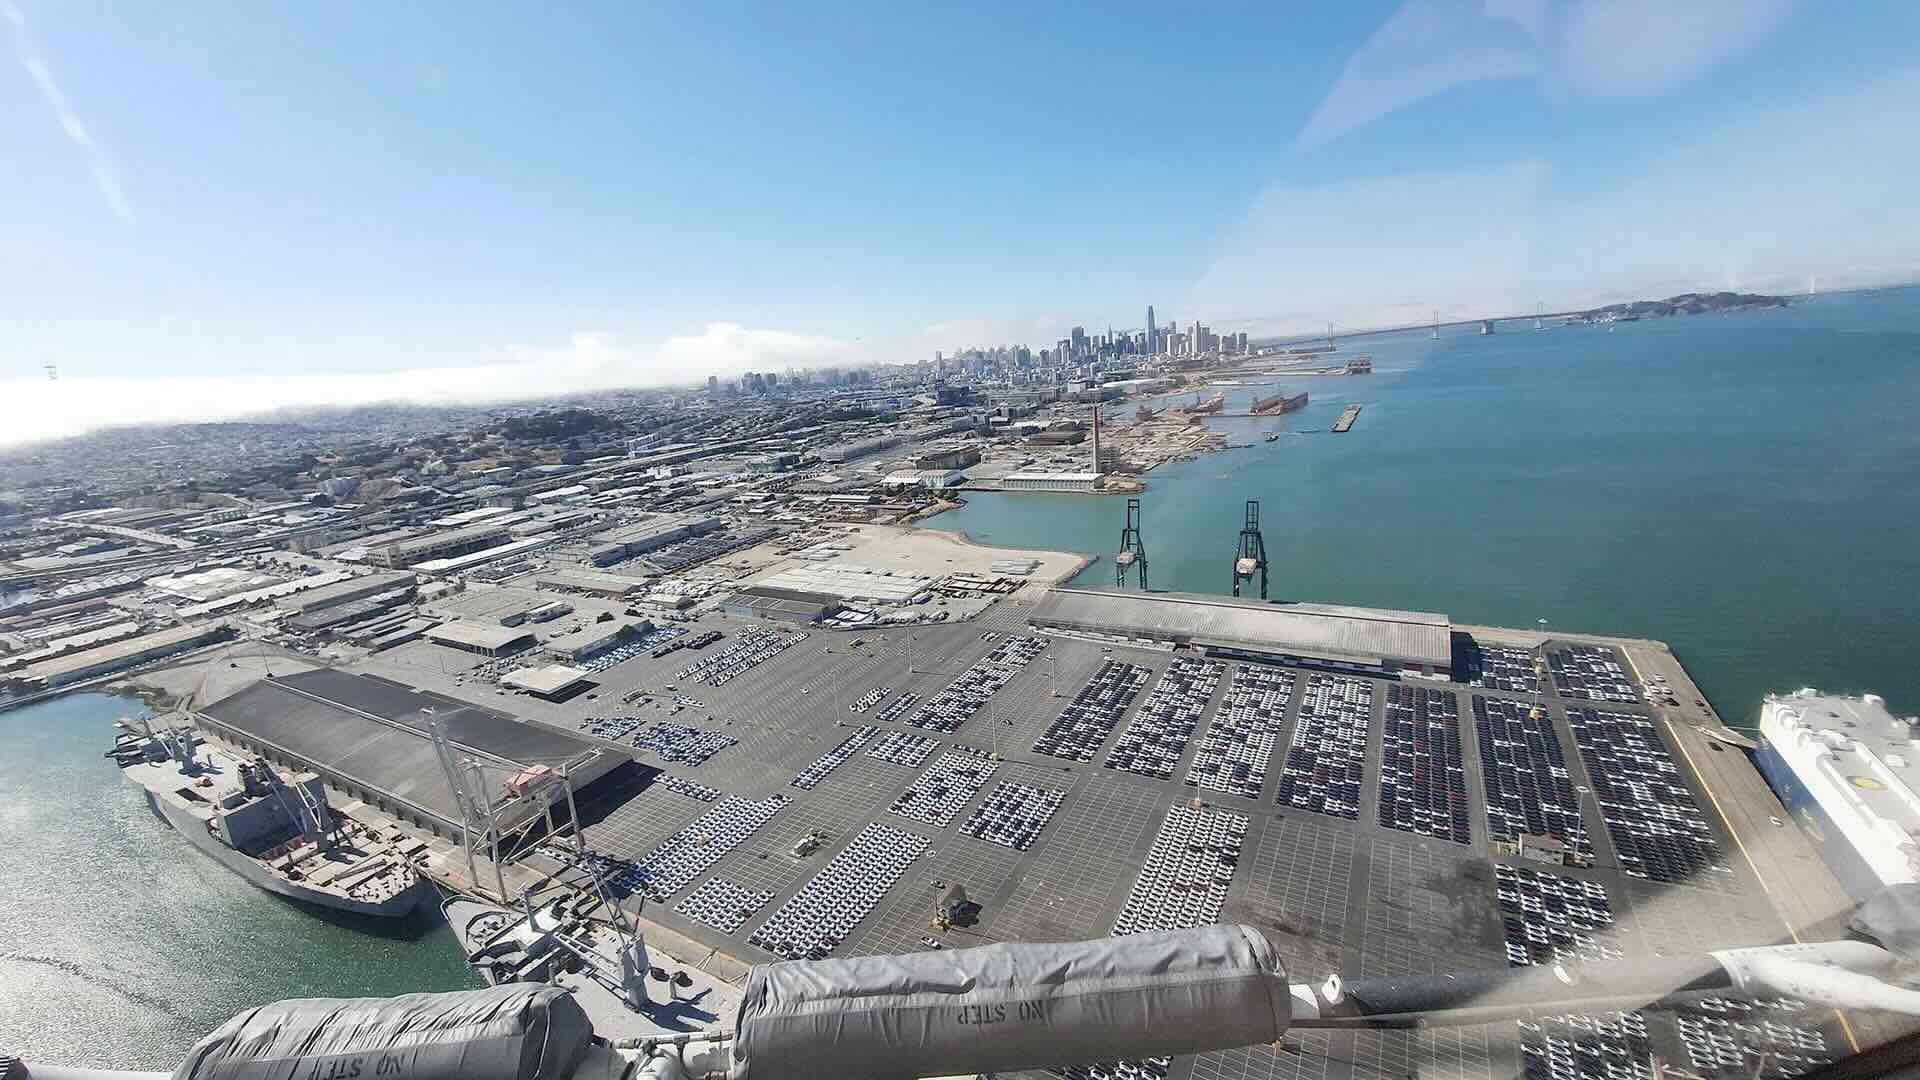 a · Pier 80
The Port’s active break-bulk and auto-export terminal, leased long-term to Pasha Stevedoring, with downtown San Francisco in the background.
a · Pier 80
The Port’s active break-bulk and auto-export terminal, leased long-term to Pasha Stevedoring, with downtown San Francisco in the background.
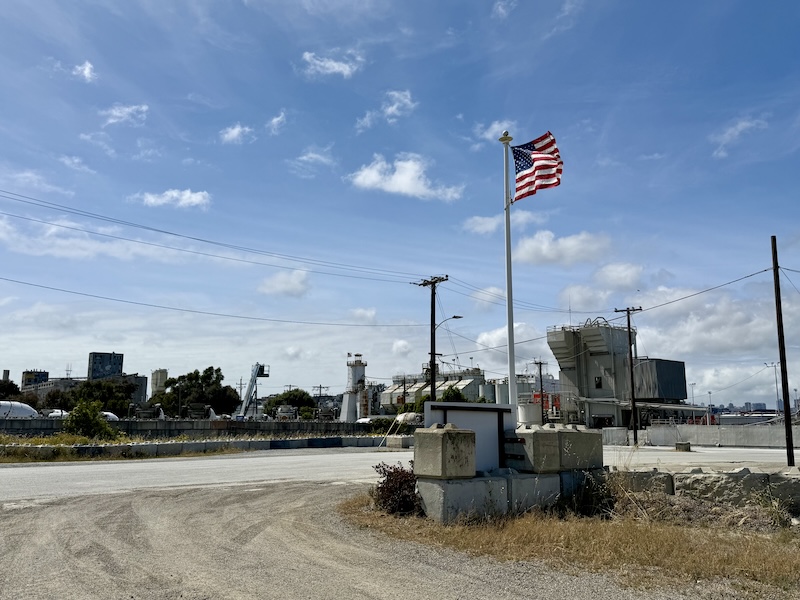 b · Pier 92
The location of the city’s two concrete batch plants (Central Concrete and Hanson Aggregates) and its sole source of ready-mix concrete supply.
b · Pier 92
The location of the city’s two concrete batch plants (Central Concrete and Hanson Aggregates) and its sole source of ready-mix concrete supply.
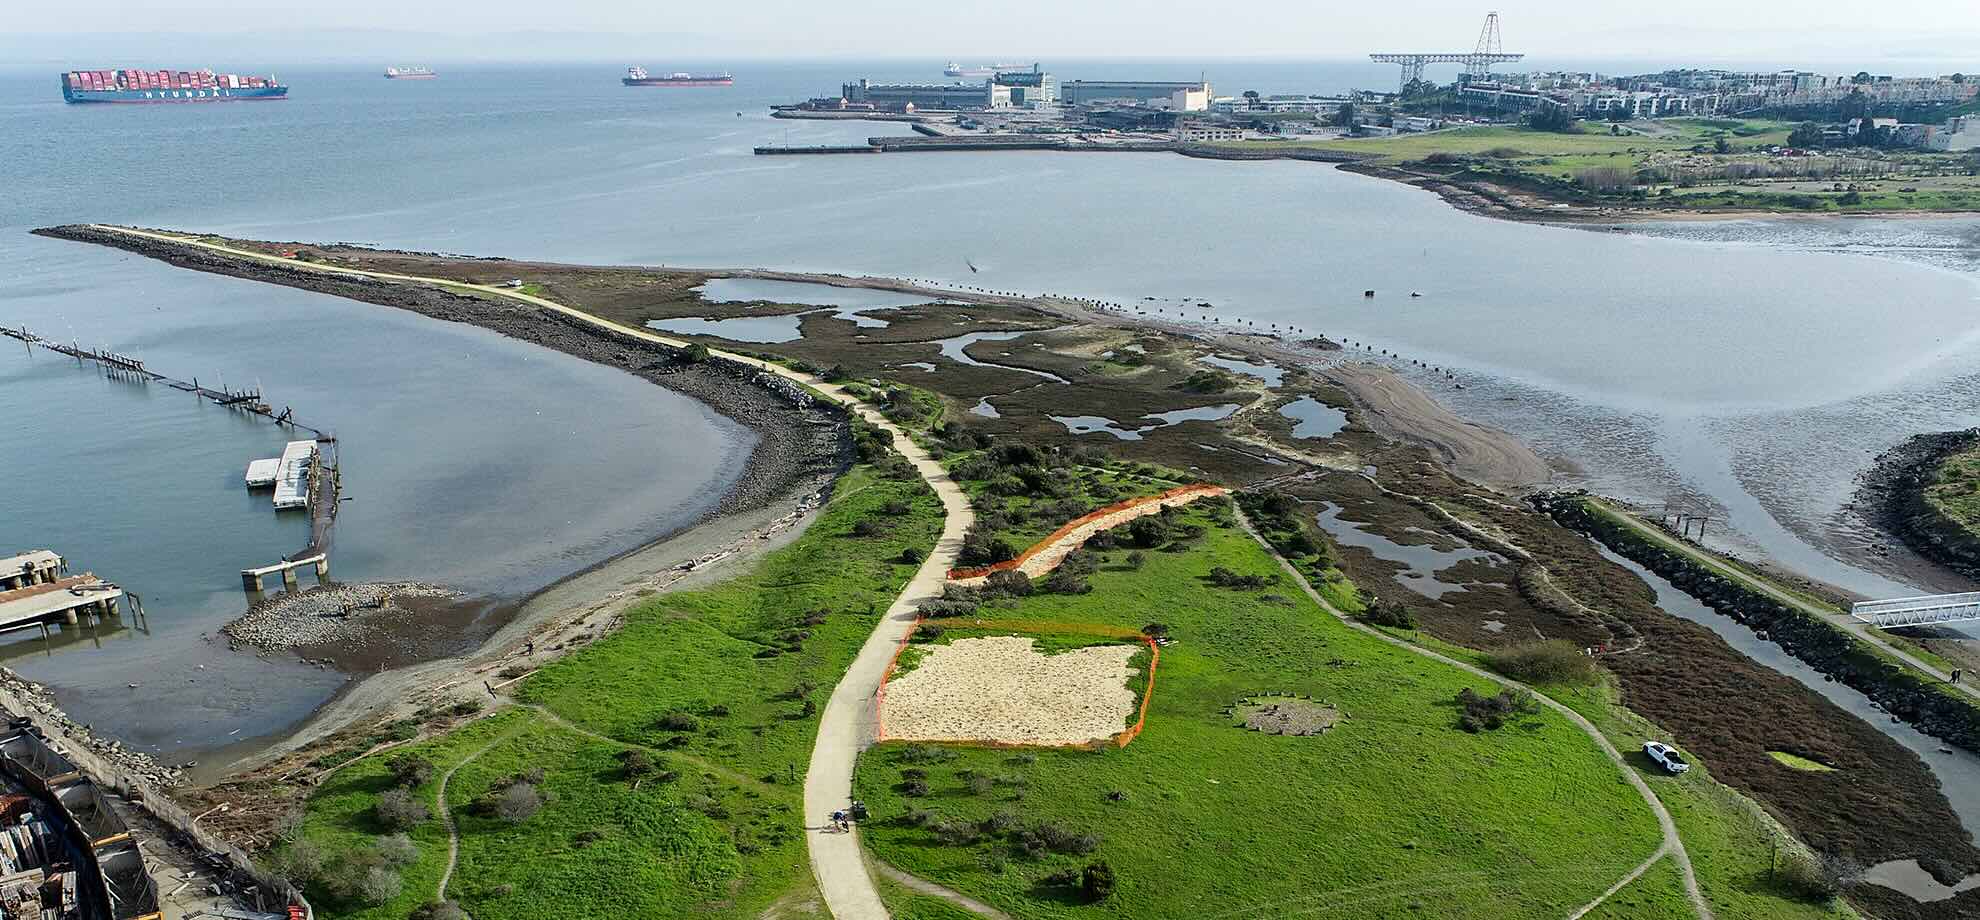 c · Heron’s Head Park
The 24-acre publicly accessible restored wetland and shoreline park at Pier 98, with the former Hunters Point Naval Shipyard visible across the channel.
c · Heron’s Head Park
The 24-acre publicly accessible restored wetland and shoreline park at Pier 98, with the former Hunters Point Naval Shipyard visible across the channel.
Two community frameworks, both now expired or inactive
On January 20, 1969, the Board of Supervisors adopted the India Basin Industrial Park Redevelopment Plan. The Plan’s principal objective, per OCII, was:
“the establishment of labor-intensive industries in the area in order to provide job opportunities for the residents of the Bayview Hunters Point community.”
The 40-year Plan formally expired on January 20, 2009. OCII describes the post-plan area as “a thriving industrial park consisting of a major distribution facility for the U.S. Postal Service, a number of light industrial, commercial service and multimedia businesses, and some retail businesses.” What OCII names — a USPS distribution facility plus light commercial, multimedia, and retail — is a different tenant mix from the labor-intensive industrial employment base the 1969 Plan was structured to create. No successor framework carries forward the 1969 rationale at the same scale.
A parallel community-driven planning effort ran in the same geography. The Bayview Hunters Point Project Area Committee was elected in 1997 and adopted the BVHP Community Revitalization Concept Plan in 2000, following hundreds of community planning meetings. The Plan included a 25% affordable housing production goal, an economic-development program directed at evaluation and cleanup of industrial brownfield sites, and a 50% goal for new jobs to be provided to San Francisco residents with first consideration for Bayview residents. The Plan operated under the San Francisco Redevelopment Agency until the statewide dissolution of redevelopment agencies in February 2012. OCII inherited the enforceable obligations as successor agency. The OCII project page is currently titled "Bayview Hunters Point - Inactive."
The 1969 India Basin Industrial Park Plan expired in 2009. The 2000 BVHP Community Plan has been inactive since 2012. Both frameworks operated in the geography that holds 80% of the Port's remaining industrial-zoned acreage (Figure 7, above). The Port's reported industrial portfolio declined 43% from FY 2015 to FY 2022 in the same geography. The community-led frameworks and the Port's industrial portfolio in this geography have both diminished over the same window.
What the Port hears from the community
Port-level community engagement with Bayview-Hunters Point currently operates through two channels: the Southern Advisory Committee, which meets at 1550 Evans Avenue and focuses on Southern Waterfront industrial-zoned acreage, and direct public comment at Commission meetings. The most extensive Bayview-specific input came in a multi-meeting public-comment series beginning August 12, 2025 raising contamination, leaseholder behavior, and Port responsiveness.
The cumulative-pollution and environmental-justice context is documented. The Hunters Point Naval Shipyard, immediately south of the Port’s Pier 96 boundary, has been on the National Priorities List as a federal Superfund site since 1989. The Department of the Navy is the responsible party. The U.S. Environmental Protection Agency maintains cleanup oversight.
Tetra Tech EC, a subsidiary of Tetra Tech Inc., served as the principal remediation contractor at Hunters Point from 2002 onward. Beginning in 2014, whistleblower disclosures and subsequent Navy and EPA investigations documented systematic data falsification in Tetra Tech's radiological-survey work at the site. An April 2018 EPA review found that 90 to 97 percent of soil samples in two areas were potentially compromised or intentionally falsified. The Navy characterized the magnitude in its victim impact statement at the federal sentencing of Tetra Tech supervisor Justin Hubbard:
“The fraud committed by Mr. Hubbard and others at Tetra Tech EC caused significant financial and reputational harm to the Navy... [It] set back the planned transfer of the Hunters Point Naval Shipyard property to the City of San Francisco by about a decade.”
The EPA has not certified the cleanup as complete. The Navy has continued to maintain that portions of the site are cleared, and has been actively engaged with EPA, the State of California, and community advocates on the scope of additional sampling required. As of 2026, the cleanup status of multiple parcels at Hunters Point Naval Shipyard, including parcels immediately adjacent to the Port’s Pier 96 industrial-zoned acreage, is unresolved.
The federal record positions Hunters Point among the country’s most contaminated sites, both in scored severity and in the federal investment committed to remediation (Figures 8, 9).

The severity scoring sits alongside a federal cleanup obligation that has run for 37 years and is projected to continue through approximately 2050.

The acreage remediated under this federal obligation, approximately 820 terrestrial acres adjacent to the Port’s Pier 90-94 industrial backlands, becomes a municipal land-use question as parcels transfer.
The District 10 residential community lives downwind of the federal Superfund property and adjacent to the active Port industrial parcels. The federal cleanup timeline materially affects what the Port’s adjacent Southern Waterfront industrial-zoned land can host. The option space for Pier 96 and the surrounding area depends on whether the federal cleanup is certified, contested, or accelerated. This essay treats that dependency as fact. The analytical engagement with what it means for BVHP residents and for the federal cleanup timeline is the subject of community-led work, which this piece does not attempt to substitute for.
The Institution
The Port of San Francisco is governed by a five-member Port Commission. Commissioners are appointed by the Mayor and confirmed by the Board of Supervisors. Terms are four years. The Commission sets policy, approves leases and contracts above certain thresholds, hires and oversees the Executive Director, and approves the biennial budget and the ten-year Capital Plan. Day-to-day operations are run by the Port Department, headed by the Executive Director. The FY 2026-27 biennial budget, adopted as Resolution 26-09 on February 24, 2026, appeared on the Consent calendar and passed unanimously in a single roll-call motion bundled with other consent items, no individual line-item discussion.
The current Commission has five sitting members as of May 2026:
- Gail Gilman, President. Appointed by Mayor Mark Farrell in 2018, reappointed by Mayor London Breed in 2022. Background in nonprofit housing and homeless services.
- Stephen Engblom, Vice President. Appointed by Mayor London Breed in 2024. Background in urban design and real estate development.
- Willie Adams, Commissioner. Originally appointed by Mayor Edwin Lee in 2012, reappointed by Mayor Breed in 2022. Background in maritime labor; former Secretary-Treasurer of the International Longshore and Warehouse Union.
- Steven Lee, Commissioner. Appointed by Mayor Breed in 2022. Small-business owner; runs restaurants in the Cruise Terminal building.
- Ken McNeely, Commissioner. Appointed by Mayor Daniel Lurie in 2025. Former AT&T California president.
The expertise distribution across the five seats is documented: nonprofit housing and homeless services, urban design and real-estate development, maritime labor, hospitality / restaurant operations, and telecommunications. No current Commissioner’s public-record professional background sits in industrial operations, advanced manufacturing, maritime-cargo logistics, or the institutional management of working-industrial real estate.
Elaine Forbes, who served as Executive Director from 2016 through 2025, announced her retirement in September 2025. Her last day at the Port was December 2025. She is now the incoming City Manager of Sausalito. Michael Martin, formerly Assistant Port Director, serves as Acting Executive Director. The Commission is conducting a permanent ED search through Berkeley Search executive recruitment. The Port also operates under the citywide hiring freeze that Mayor Lurie’s office announced in January 2025, which has constrained Port staffing during the same period the Capital Plan adoption, strategic-plan refresh, budget cycle, and ED transition have all required capacity from the institution. Two transitions are in progress at the same time. The permanent Executive Director seat is unfilled. Three of five Commission seats expire in May 2026.
Mission, vision, and stated strategic priorities
The Port published its 2026-2030 Strategic Plan in February 2026 under Acting ED Michael Martin. The seven strategic goals shifted the pandemic-bracketed “Economic Recovery” framing into a forward-looking “Economic Growth” framing. “Productivity” (tenant attraction) was absorbed into “Economic Growth” and is no longer a discrete strategic goal.
The Plan names specific projects under Economic Growth: advancing Fisherman’s Wharf Forward, furthering housing development at Seawall 330, Mission Rock, and Pier 70, advancing a secondary electrified cruise terminal, launching a Blue Economy Incubator Program, and developing a plan to support California’s offshore wind goals and grow maritime industries. None of the seven goals is directed at industrial preservation, industrial tenancy growth, or maintaining the industrial portfolio as such. The closest references are a single mention of “grow maritime industries” under Economic Growth, the inclusion of “Bay-dependent industries, including fishing” under Sustainability, and Pier 70 named as a site for further housing development.
The Port of Oakland adopted its own 2025-2030 Strategic Plan in February 2025, twelve months before San Francisco’s. The two ports operate under the same California public-trust framework, and both adopted distinct strategic visions within the same twelve-month window. Oakland’s plan names three operating segments (seaport, airport, commercial real estate) and identifies tidelands-trust compliance as a continuing constraint across all three (the Port of Oakland’s asset mix is documented in Part 1). The two adjacent California ports, operating under the same state public-trust framework and sharing a single regional economy, have published strategic visions that do not align on industrial preservation as a priority and do not reference each other.
How the Port Got Here
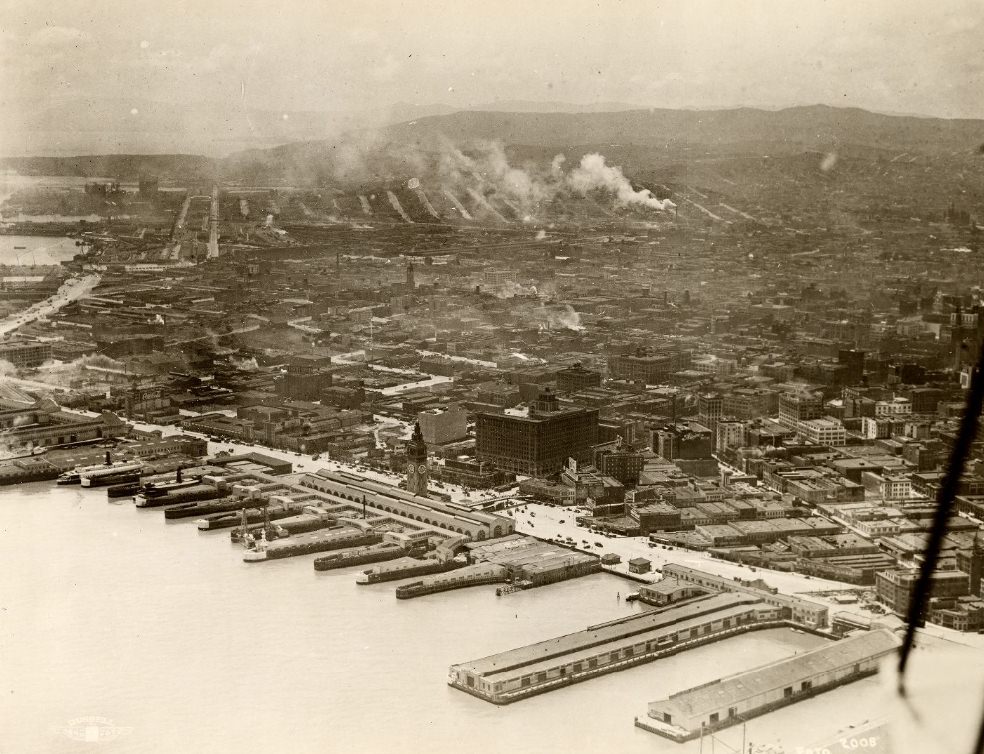
San Francisco’s political history maps onto a sequence of eras (Figure 10, Figure 11). The Port’s history runs along the same timeline with one or two key moves anchoring each era.
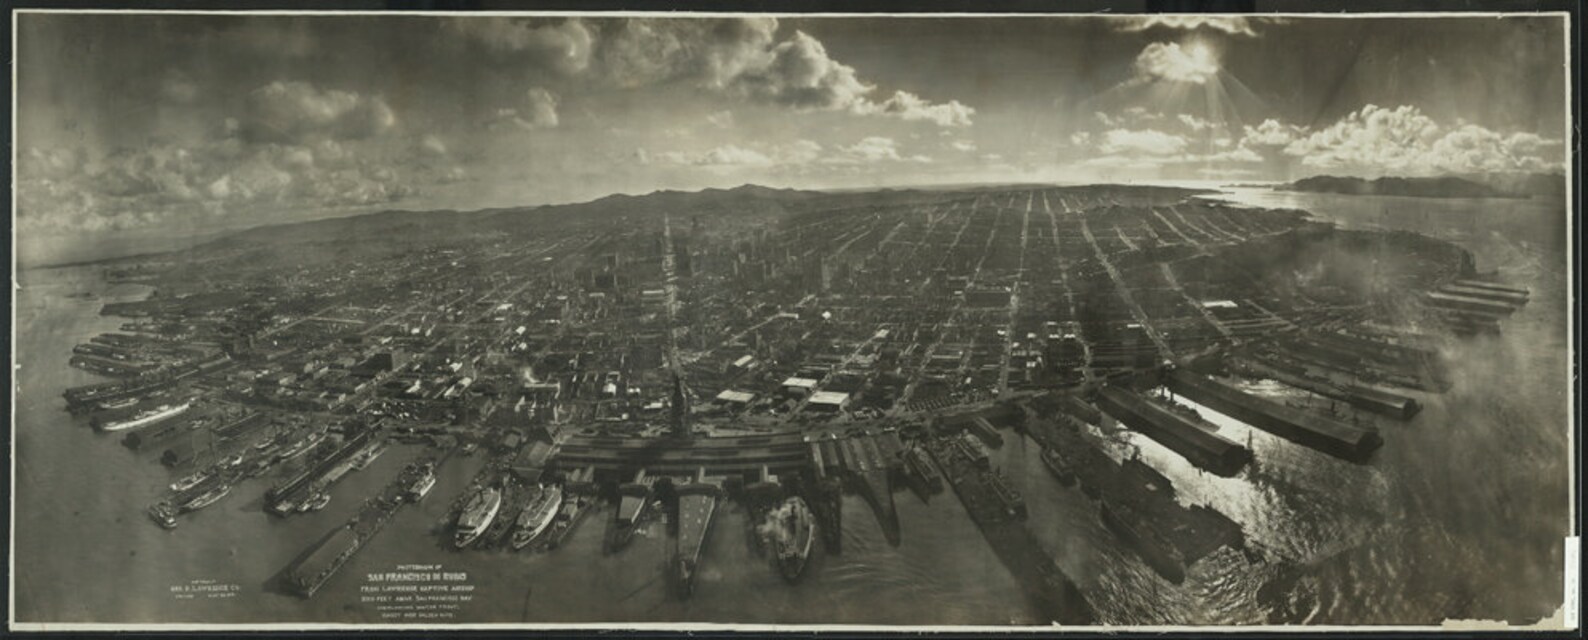
Industrial Revolution and Progressive eras (1856 to pre-WW2). The State Board of Harbor Commissioners, established in 1863, governs the working waterfront under direct state authority; the Embarcadero is filled and the seawall built between 1878 and 1916. The waterfront is the city’s economic engine through the period.
WW2 / Modern era (WW2 through ~1960). Full industrial mobilization on the eastern waterfront. The Hunters Point Naval Shipyard becomes one of the largest naval shipbuilding facilities on the West Coast, with peak employment in 1945 of 18,235 workers; the Port operates at maximum industrial throughput.
Environmentalism / Post-modern era (~1960 to present). The reform pressures invert. Containerization between 1960 and 1966 collapses the labor-intensive break-bulk model. Waterborne-commerce employment in San Francisco falls from 23,000 jobs in 1964 to 11,000 in 1978. The McAteer-Petris Act (1965) and BCDC (1969) establish regulatory constraints on Bay fill. The 1968 Burton Act transfers tideland property from the state to the City. The Hunters Point Naval Shipyard closes in 1974 with under 7,500 jobs remaining, becoming a federal Superfund site.
The containerization shift carried a physical constraint. The pier-finger geometry of the San Francisco waterfront, built in the 1900s for break-bulk and passenger shipping, was incompatible with the marshalling-yards, crane spans, and intermodal rail access containerized cargo requires. Oakland, with its larger landside footprint and direct rail connection, captured the regional container traffic.

The same year industrial employment is collapsing across the eastern waterfront, the City moves in the opposite direction in Bayview. On January 20, 1969, the Board of Supervisors adopts the India Basin Industrial Park Redevelopment Plan to create labor-intensive jobs for Bayview residents (Section 6). The 40-year plan would expire on January 20, 2009 with no equivalent-scale successor.
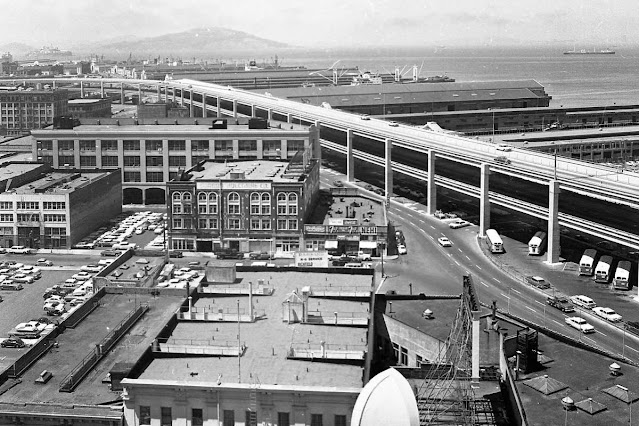
The northern waterfront takes the opposite trajectory, driven by physical reconfiguration. The double-deck Embarcadero Freeway (opened 1959) walls off the northern piers from the city, carrying ~70,000 vehicles daily near the Ferry Building at peak (Figure 12). A June 1986 Mayor Feinstein-championed ballot measure to replace it with a boulevard fails 58-42. Three years later, the October 1989 Loma Prieta Earthquake damages the freeway beyond repair; under Mayor Agnos, the Board of Supervisors votes 6-5 to remove it, and demolition begins February 27, 1991. Freeway removal is the physical precondition for the hospitality-and-retail buildout Part 1 documents.
Proposition H (1990) bans hotels on piers and requires a recurring Waterfront Land Use Plan. The Port pivots from maritime-industrial operation to a hybrid model in which non-maritime revenue becomes the dominant financial engine, and the two coastlines diverge over the next thirty-five years to the point Section 10 closes on.
How the Commission Operates
The Port Commission meets twice monthly when it meets. The published 2026 meeting schedule listed 19 meetings. As of late May 2026, two had been cancelled (March 24 and May 26), leaving 17 scheduled. The Commission adopts approximately 60 to 70 resolutions per year. Nearly all are unanimous, and the substantial majority are adopted on the Consent calendar in a single bundled motion without individual discussion. The April 22, 2025 10-Year Capital Plan and the February 24, 2026 biennial budget were both approved on Consent, with no Commissioner questions. The institution that holds the public trust mandate for 600 acres of San Francisco’s working waterfront conducts most of its formal decision-making through unanimous, undiscussed approvals of bundled items. The Commission deliberates substantively when an item is contested or requires statutory adjudication. Most agenda items do not meet that threshold and are approved on Consent. The Bauer Intelligent Transportation lease dispute on January 14, 2025, walked through in the next subsection, is one of the more recent instances of substantive deliberation.
When the body deliberates
The Bauer Intelligent Transportation lease dispute, which came before the Commission on January 14, 2025, is the recent documented case of the body engaging at length. Bauer, a private commuter-bus operator, leased Port property near Pier 50 for vehicle storage. The lease was in arrears. The Port had moved to terminate. Bauer contested. The matter came to the Commission as a substantive agenda item rather than a Consent action. Commissioners individually questioned Port staff, asked specific questions about lease terms, and pressed on operational logistics. When the Commission is required to deliberate, it deliberates.
Engblom's February 24, 2026 New Business item in context
At the close of the February 24, 2026 Commission meeting, Vice President Stephen Engblom raised a New Business item proposing two things: a bundled-concessionaire bonding mechanism that would allow the Port to monetize future concession revenue against current capital need, and a reconsideration of Proposition H. The item was raised under New Business, did not appear on the formal agenda, and was not voted on. It is the latest surfacing of a question the Port has revisited at roughly decade intervals since Prop H passed.
The April 24, 2017 San Francisco Chronicle column by John King documents that the Port, working through its Waterfront Plan Working Group, had commissioned a feasibility analysis of hotel use on piers, including Pier 28 under the Bay Bridge. At the Land Use subcommittee meeting where the analysis was presented, the State Lands Commission’s Executive Officer said:
“There is nothing in California like the Embarcadero. That might be an argument for taking a more flexible and creative approach... There’s an evolutionary nature to the public trust and how it accommodates society’s needs.”
The 2017 process did not result in a ballot measure or a Prop H amendment. The question was studied and shelved.
The longer thread pairs voter-driven and executive-driven moves: 1969 (India Basin Industrial Park Plan adoption), 1986 (Embarcadero Freeway demolition ballot measure rejected), 1989-91 (Loma Prieta plus executive emergency action achieves what the ballot could not), 1990 (Prop H enacted against Port opposition), 2017 (hotel feasibility studied and shelved), 2026 (Engblom New Business item, outcome pending). Two of the six involve voters. The other four are executive or staff-led moves. What the six moves show: when voters have engaged, they have engaged in 1986, 1989-91, and 1990. When executives have engaged, they have engaged in 2017 and 2026. The Port has revisited Prop H at roughly decade intervals across the 35 years since adoption.
Maritime relief, industrial market-rate
A pattern visible in the Port's leasing record is an asymmetry between how maritime-tenant rent relief is structured and how industrial-tenant lease terms are structured (Figure 13).

On the maritime side, rent relief and tenant-supportive lease structures are codified and exercised routinely: salmon and crab receiver rent waivers codified in the commercial fishing harbor lease structure; six-month salmon vessel berth waivers granted seasonally without case-by-case Commission approval; the March 2026 leasing efficiency package (Resolutions 26-14 through 26-18) setting parameter rent for maritime triple-use tenants at 75% of market, a structural reduction codified as policy.
On the industrial side, lease structures for the construction-equipment-staging tenancy that increasingly fills the Southern Waterfront piers do not include equivalent relief mechanisms. Recent leasing decisions have queued additional construction-equipment operations as pass-through market-rate ground leases without analogous codified relief.
The Pier 90 grain silo demolition project, approved in 2025, is described in Port materials as creating “leasable space for potential other maritime tenants.” The framing identifies a supply-side intent without a corresponding documented demand-side strategy for attracting the maritime tenants the cleared space is intended for. The Port subsidizes the maritime tenancy it has through codified rent relief. Industrial tenancy on the Southern Waterfront is leased at market rate, with no equivalent relief framework. The two categories map onto different geographies: maritime relief flows largely to the Northern Waterfront fishing harbor, and market-rate industrial leases sit largely on the Southern Waterfront.
The Summer 2026 Decision Window
Three Commission seats expire in May 2026: Willie Adams, Gail Gilman, and Steven Lee. Mayor Lurie holds the appointment authority for all three. Adams and Gilman are completing second-term tenures spanning more than a decade across three administrations. Lee is in his first full term. The two seats not expiring are Stephen Engblom (term to 2028) and Ken McNeely (term to 2029), the latter Lurie’s first appointment. Whatever Commission emerges from Summer 2026, three of the five seats are being set by Lurie (Figure 14).

The Executive Director seat is being recruited through Berkeley Search. The timeline anticipates a permanent ED during the second half of 2026, overlapping with the new Commission composition. The Commission Streamlining Task Force, established under Proposition E of 2024, issued its findings during 2025. It recommended retaining the Port Commission as a body and eliminated the Waterfront Design Advisory Committee.
The next Commission will inherit a documented $2.6 billion unfunded capital backlog, a strategic plan that does not name industrial preservation as a priority, and an industrial portfolio that has declined 43% in reported acreage over the prior seven years. It will also inherit a city-within-the-city operating under a citywide hiring freeze, and a 35-year thread on Prop H reconsideration whose latest surfacing in February 2026 is awaiting Commission action.
What This Mapping Does and Does Not Argue
This essay maps what is. It does not argue what should be.
The maritime portion of the Port’s operating revenue is 18%. The industrial-portfolio acreage as reported has declined by 43% over seven years. The 2026-2030 Strategic Plan does not include industrial preservation as a stated priority. The 10-Year Capital Plan funds 16% of identified state-of-good-repair need. The 1969 India Basin Industrial Park Plan expired in 2009 with no equivalent-scale successor. The 2000 BVHP Community Plan is inactive. The Prop H reconsideration thread spans 57 years across four documented surfacings. Three Commission seats expire in May 2026; Executive Director succession is in progress. A privately-operated 32-acre industrial property one mile from Pier 70 has been continuously operating with sustained occupancy across the same period.
One framing is likely to surface in response to this record. Industrial-zoned land in a housing-constrained city, the argument goes, should be converted to housing. The binary is, on this same waterfront, already false. Mission Rock and Pier 70 are mixed-use industrial-and-residential developments under Port jurisdiction. The American Industrial Center one mile inland operates with residential immediately adjacent. The working models in 2026 are mixed. The question on the table is not whether to convert industrial-zoned land to housing or to preserve it as is. The Eastern Neighborhoods rezoning and the working San Francisco models already show how the two coexist. The question is what happens to the industrial-zoned share in the existing mix as the next ten years of land-use decisions play out.
Three analytical frames recur when these facts are considered at scale. The first is national industrial geography. When a major American metropolis with 600 acres of working waterfront documents a 43% decline in reported industrial-portfolio acreage over seven years, the question of where displaced industrial capacity goes is not a local question. California Forever, El Segundo’s reindustrialization, and Austin’s defense and manufacturing buildout are partial answers to a continental question. The second is national security. Maritime industrial capacity and federal industrial-base resilience are documented federal priorities in 2026, and the Army Corps of Engineers’ San Francisco Waterfront Coastal Flood Study (covered in Part 1, up to $13.5 billion in potential federal share) is one signal of that federal posture. The third is jobs. The 1969 India Basin Industrial Park Plan was structured to produce labor-intensive industrial employment for Bayview-Hunters Point residents. The 2000 BVHP Community Plan set a 50% goal for new jobs to be provided to San Francisco residents with first consideration for Bayview residents. Both frameworks are now expired or inactive.
A note on scopeThis essay treats the Bayview-Hunters Point geography as institutional context for the Port’s Southern Waterfront industrial-zoned acreage. It does not treat the BVHP community as the protagonist of its own waterfront. The 1969 India Basin Industrial Park Plan and the 2000 BVHP Community Plan are documented here as institutional artifacts and were also community-organized frameworks that residents in District 10 fought for. The racial-zoning history that placed the city’s noxious uses in or adjacent to Black and Pacific Islander communities is referenced here as result, not subject. A follow-up piece centered on BVHP as protagonist is in development, written with the community rather than after it.
The arguments these facts could support will also have to engage the contexts the record names. Commission appointment criteria for the Summer 2026 window. A strategic vision for industrial-zoned waterfront on a 20-year horizon. Federal cleanup acceleration at Hunters Point. The public-trust legal flexibility documented in the 2017 Lucchesi statement. And the relationship between the Port regime and the PDR regime that governs the city’s other industrial-zoned land.
What happened to San Francisco’s industrial waterfront? What this piece records is the answer to that question. What comes next? is the question that follows. The first question is answerable from public sources, financial filings, meeting minutes, and the record the Port itself maintains. The second is being answered now, in real time: the Summer 2026 appointment window is open, the Executive Director succession is in progress, and the Capital Plan governs through FY 2035. These are the decisions, and the timeline, that will determine what answer the next ten years record.
← Part 1 · Industrial Waterfront What Happened to San Francisco’s Industrial Waterfront The first part of this two-part essay maps the 600-acre portfolio, where the operating revenue comes from, what happened to the industrial portfolio between FY 2015 and FY 2022, and the $2.6 billion unfunded capital backlog.